
How to Request a Quote

Form
Please download and fill in the

Email
And then send the form to [email protected]

Feedback
We will contact you by email as soon as possible, please make sure your Email address is correct and check your email in time.
1. Overview
Transcriptome sequencing is a high-throughput sequencing of the total RNA produced by a certain species or a specific cell in a certain functional state, but now we mainly use it to detect mRNA.
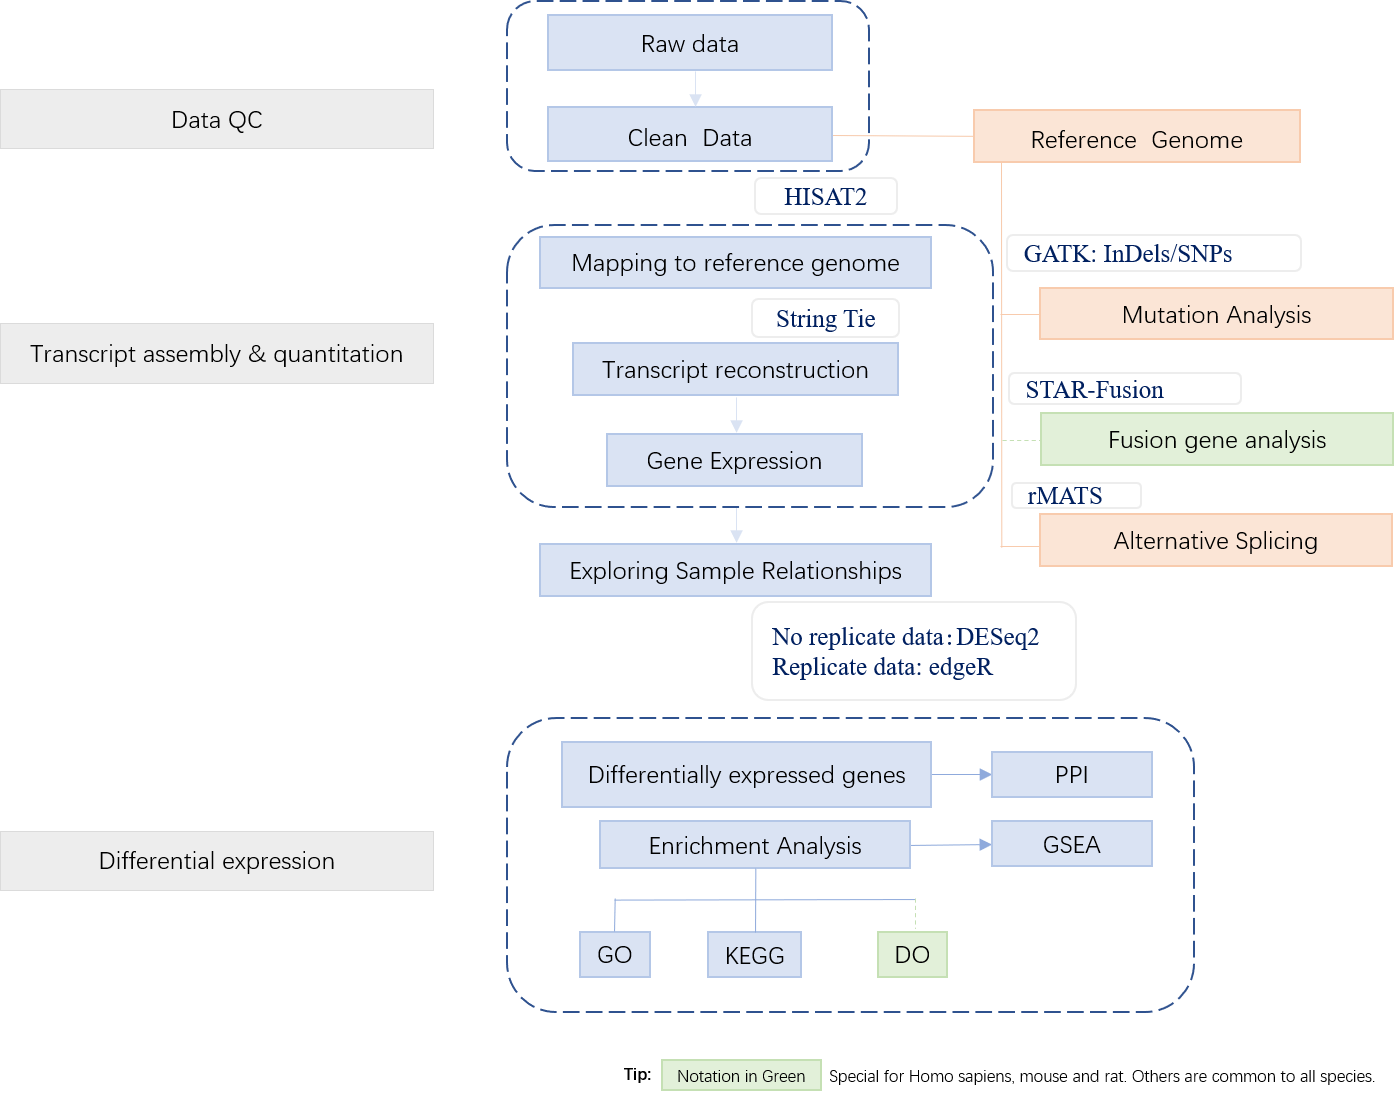
APExBIO’s services not only detect differences in gene expression levels, but also provide structural analysis. Our work is to help you discover unknown transcripts and rare transcripts, and accurately identify differentially variable splicing sites, gene fusions, SNPs and InDel mutations, etc. The results can be applied to research on growth and development regulation mechanism and pathogenesis of major human diseases.
2. Workflow
Data Preparation
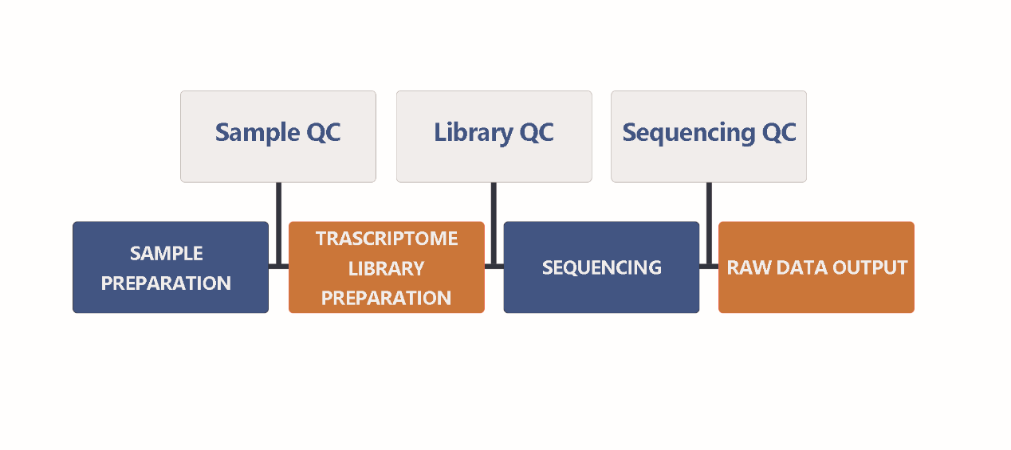
Normally, more than 90% of RNA is rRNA in the sample, so it is necessary to enrich the mRNA after extracting the total RNA. After that, synthesize cDNA by mRNA reverse transcription to construct a library. Then, sequencing the purified cDNA library. The figure below shows the basic steps of the pipeline:
Bioinformatics Analysis
3. Applications
3.1 Metabolome and Transcriptome Sequencing Analysis Reveals Anthocyanin Metabolism in Pink Flowers of Anthocyanin-Rich Tea (Camellia sinensis)
Abstract
Almost all flowers of the tea plant (Camellia sinensis) are white, which has caused few researchers to pay attention to anthocyanin accumulation and color changing in tea flowers. A new purple-leaf cultivar, Baitang purple tea (BTP) was discovered in the Baitang Mountains of Guangdong, whose flowers are naturally pink, and can provide an opportunity to understand anthocyanin metabolic networks and flower color development in tea flowers. In the present study, twelve anthocyanin components were identified in the pink tea flowers, namely cyanidin O-syringic acid, petunidin 3-O-glucoside, pelargonidin 3-O-beta-d-glucoside, which marks the first time these compounds have been found in the tea flowers. The presence of these anthocyanins seem most likely to be the reason for the pink coloration of the flowers. Twenty-one differentially expressed genes (DEGs) involved in anthocyanin pathway were identified using KEGG pathway functional enrichment, and ten of these DEG’s screened using venn and KEGG functional enrichment analysis during five subsequent stages of flower development. By comparing DEGs and their expression levels across multiple flower development stages, we found that anthocyanin biosynthesis and accumulation in BTP flowers mainly occurred between the third and fourth stages (BTP3 to BTP4). Particularly, during the period of peak anthocyanin synthesis 17 structural genes were upregulated, and four structural genes were downregulated only. Ultimately, eight critical genes were identified using weighted gene co-expression network analysis (WGCNA), which were found to have direct impact on biosynthesis and accumulation of three flavonoid compounds, namely cyanidin 3-O-glucoside, petunidin 3-O-glucoside and epicatechin gallate. These results provide useful information about the molecular mechanisms of coloration in rare pink tea flower of anthocyanin-rich tea, enriching the gene resource and guiding further research on anthocyanin accumulation in purple tea.
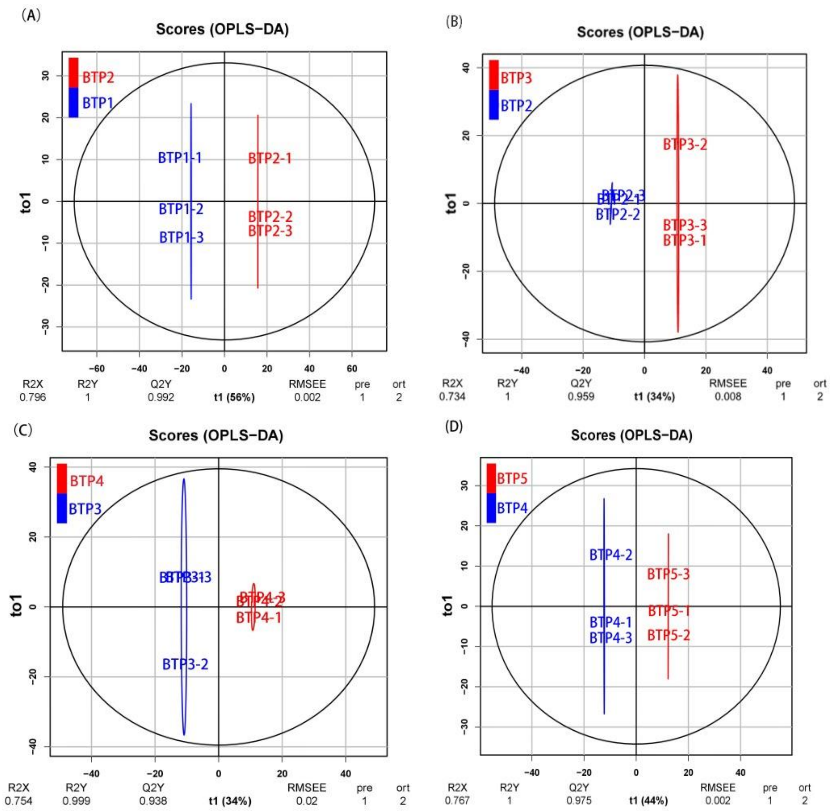
Figure 3.1.1 The OPLS-DA results indicated that the main biological components were significantly changed along with changing stages of development. Figure 3.1.1 is an OPLS-DA plot showing the significance of change in metabolic profile moving from one development stage to the next. Figure 3.1.1 shows the composition between the first stage and second stage (BTP1 vs. BTP2), second stage and third stage (BTP2 vs. BTP3), third stage and fourth stage (BTP3 vs. BTP4) and fourth stage and fifth stage (BTP4 vs. BTP5) respectively clustered together in the OPLS score plots. The R2Y of this OPLS-DA model was 1.0, 1.0, 0.999 and 1.0 in metabolomic differences of different floral development, respectively. While, the Q2Y of the model was 0.992, 0.959, 0.938 and 0.975 (from BTP1 to BTP5), respectively. These data demonstrate highly significant differences in metabolite profiles based on development stage.
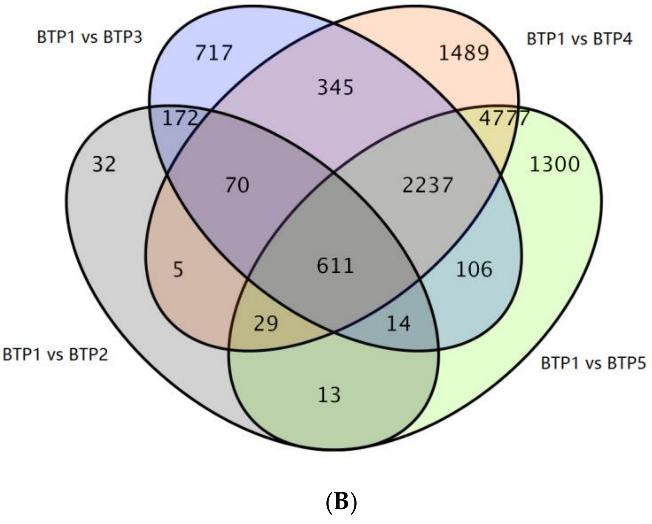
Figure 3.1.2 Venn Diagram of DEGs between 4 groups
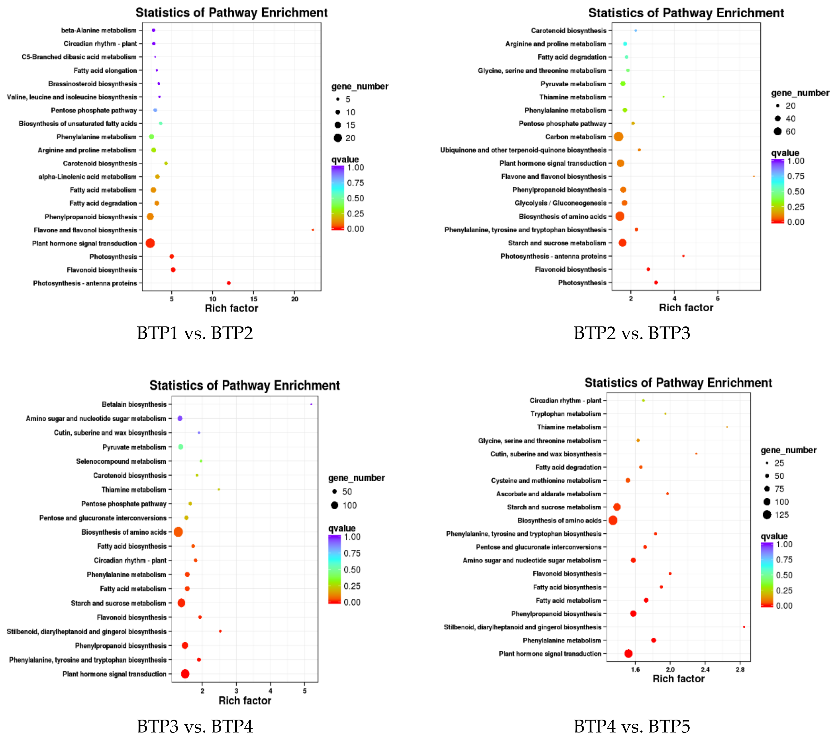
Figure 3.1.3 KEGG enrichment analysis of DEGs in different tea development stages.
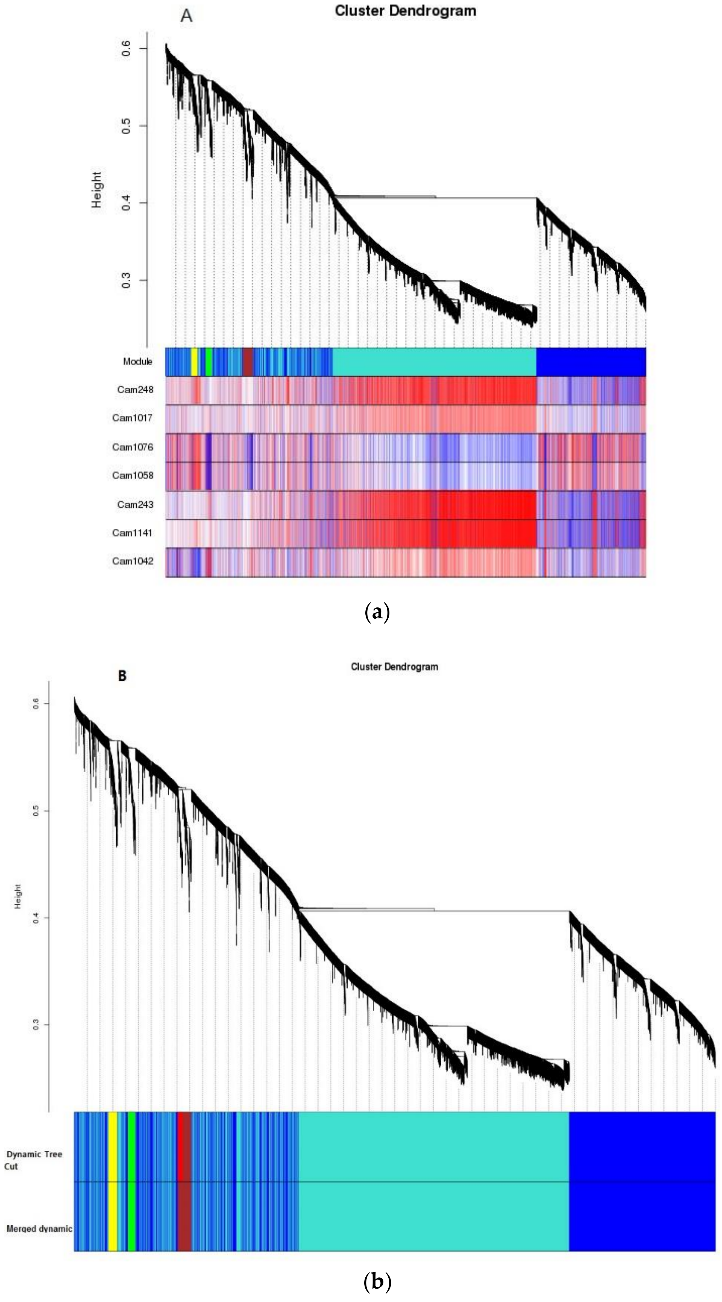
Figure 3.1.4 To reveal the gene expression levels involved in anthocyanins and flavonoid metabolism pathways, modules associated with anthocyanins were obtained by WGCNA. A module can be thought of as a cluster of closely interconnected genes. The interconnectedness of two genes is a combination of adjacency between them, and the strength of connections they share with other “third party” genes. This measure of proximity used by WGCNA is known as topological overlap measure (TOM). Using TOM, WGCNA clusters data into the type of dendrogram “tree” pictured in Figure 8A, B. Individual branches of the tree represent clusters of interconnected genes, which are then defined as “modules.” Each module is measured for co-expression with the trait phenotype, in this case flavonoids, in order to see what cluster of common genes is co-expressed with flavonoids in BTP flowers
3.2 Cardiac and Skeletal Muscle Transcriptome Response to Heat Stress in Kenyan Chicken Ecotypes Adapted to Low and High Altitudes Reveal Differences in Thermal Tolerance and Stress Response
Abstract
Heat stress (HS) negatively affects chicken performance. Agricultural expansion will happen in regions that experience high ambient temperatures, where fast-growing commercial chickens are vulnerable. Indigenous chickens of such regions, due to generations of exposure to environmental challenges, might have higher thermal tolerance. In this study, two indigenous chicken ecotypes, from the hot and humid Mombasa (lowland) and the colder Naivasha (highland) regions, were used to investigate the effects of acute (5 h, 35°C) and chronic (3 days of 35°C for 8 h/day) HS on the cardiac and skeletal muscle, through RNA sequencing. The rectal temperature gain and the number of differentially expressed genes (DEGs) [False Discovery Rate (FDR) < 0.05] were two times higher in the acute stage than in the chronic stage in both ecotypes, suggesting that cyclic exposure to HS can lead to adaptation. A tissue- and stage-specific difference in response to HS was observed, with peroxisome proliferator-activated-receptor (PPAR) signaling and mitogen-activate protein kinase (MAPK) signaling pathways, enriched in heart and skeletal muscle, respectively, and the p53 pathway enriched only in the acute stage in both tissues. The acute and chronic stage DEGs were integrated by a region-specific gene coexpression network (GCN), and genes with the highest number of connections (hub genes) were identified. The hub genes in the lowland network were CCNB2, Crb2, CHST9, SESN1, and NR4A3, while COMMD4, TTC32, H1F0, ACYP1, and RPS28 were the hub genes in the highland network. Pathway analysis of genes in the GCN showed that p53 and PPAR signaling pathways were enriched in both low and highland networks, while MAPK signaling and protein processing in endoplasmic reticulum were enriched only in the gene network of highland chickens. This shows that to dissipate the accumulated heat, to reduce heat induced apoptosis, and to promote DNA damage repair, the ecotypes activated or suppressed different genes, indicating the differences in thermal tolerance and HS response mechanisms between the ecotypes. This study provides information on the HS response of chickens, adapted to two different agro climatic environments, extending our understanding of the mechanisms of HS response and the effect of adaptation in counteracting HS.
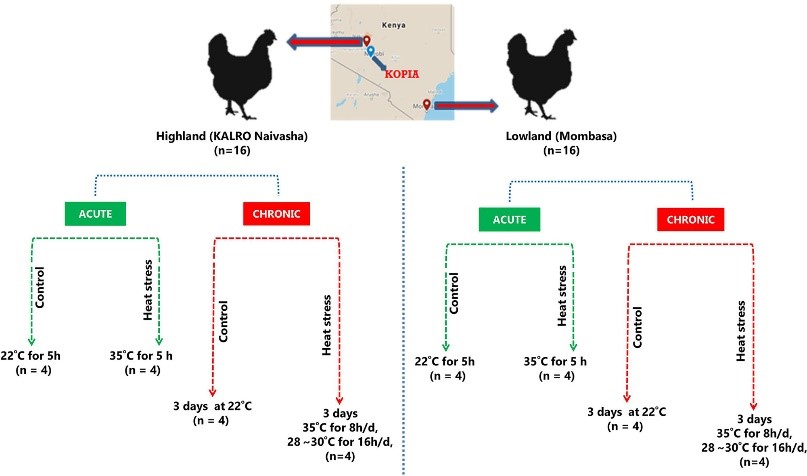
Figure 3.2.1 Schematic experimental design.
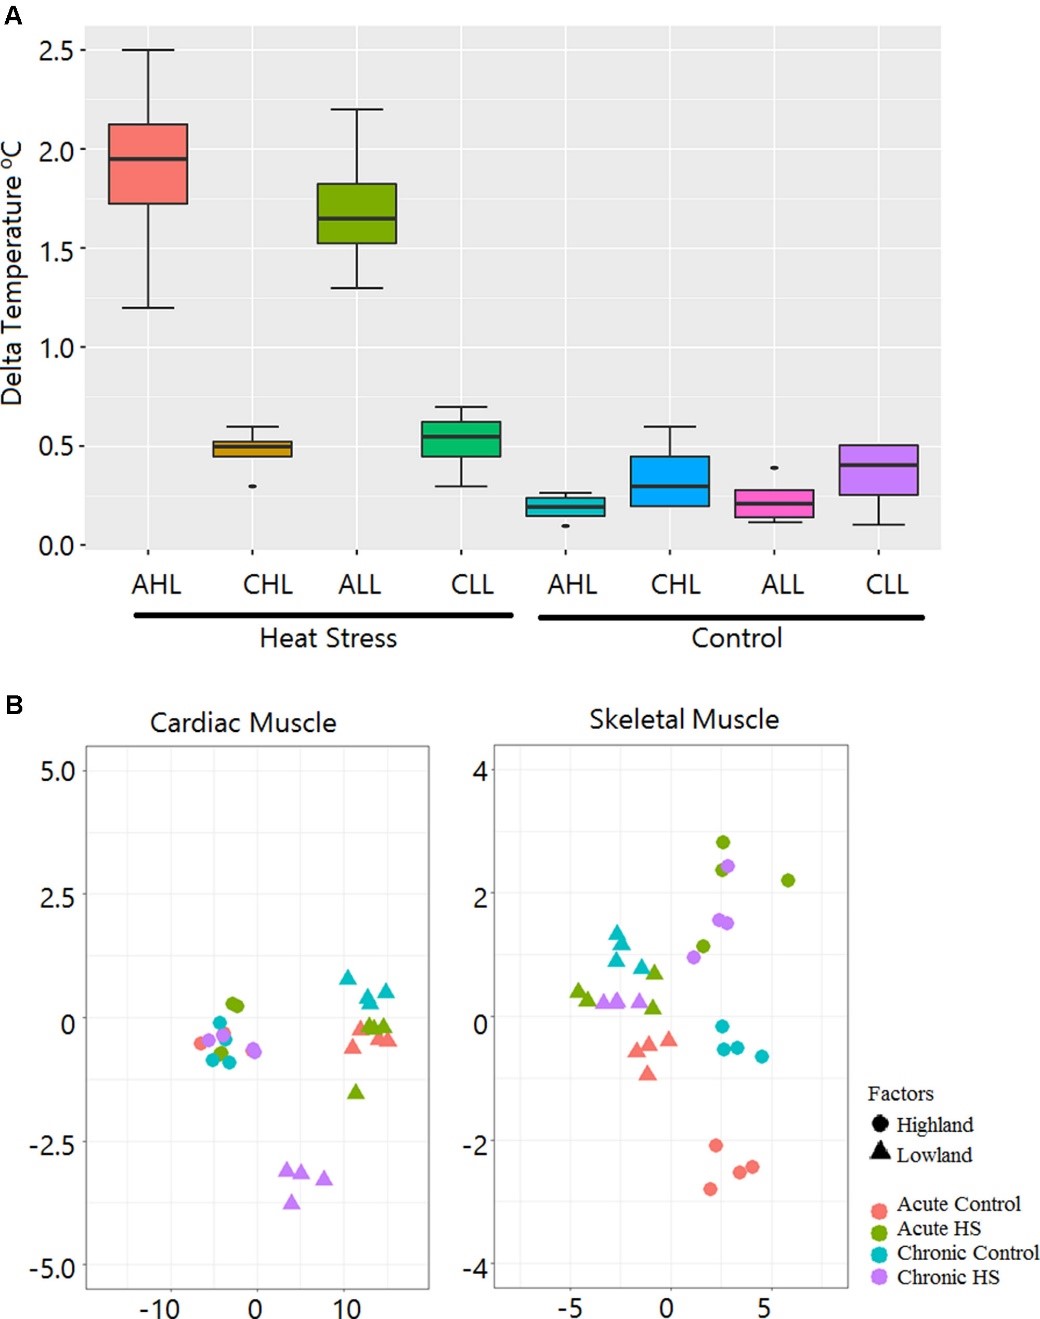
Figure 3.2.2 Rectal temperature gain during HS treatment and sample relationship inferred from principal components analysis. (A) Box plot showing gain in rectal temperature due to HS treatment. AHL, acute highland; CHL, chronic highland; ALL, acute lowland; CLL, chronic lowland. (B) Principal components analysis showing that the maximum variation is due to differences between the ecotypes. Only a small percentage of the variation is due to the HS effect.
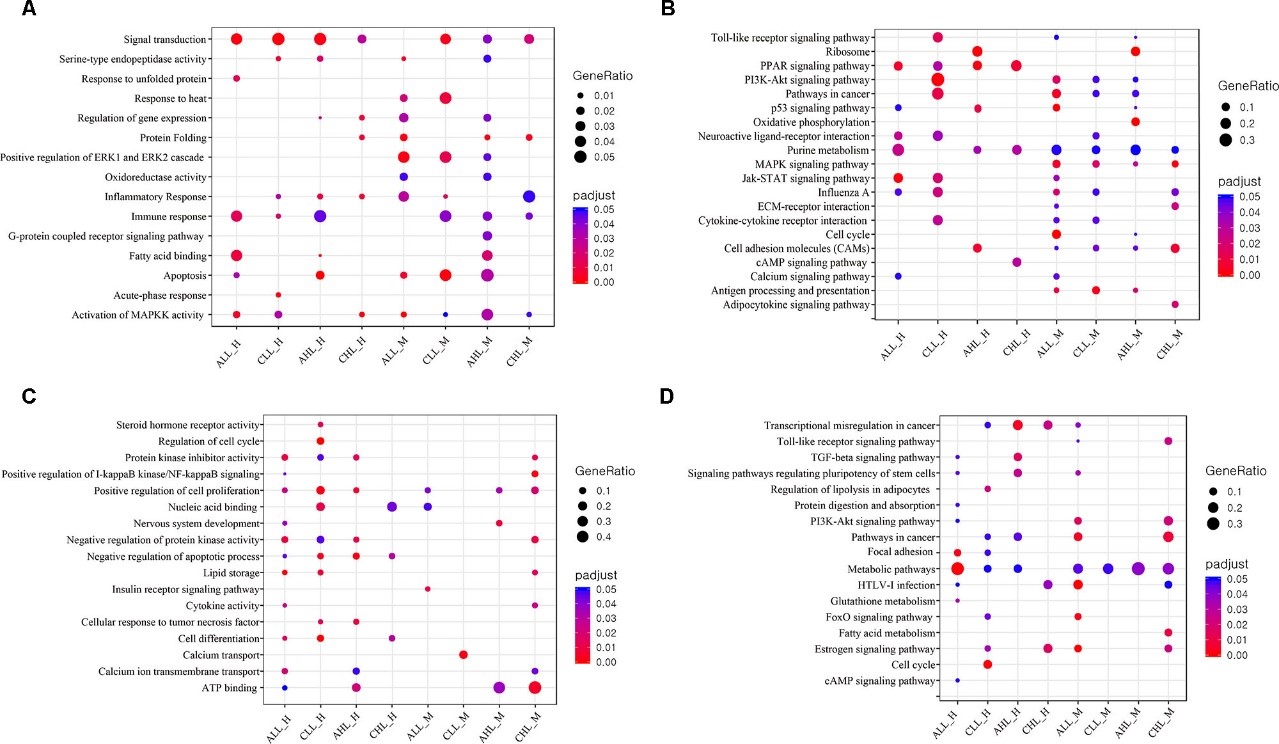
Figure 3.2.3 GO and KEGG pathway enrichment analysis (A) Dot plot shows the up-regulated GO terms (FDR
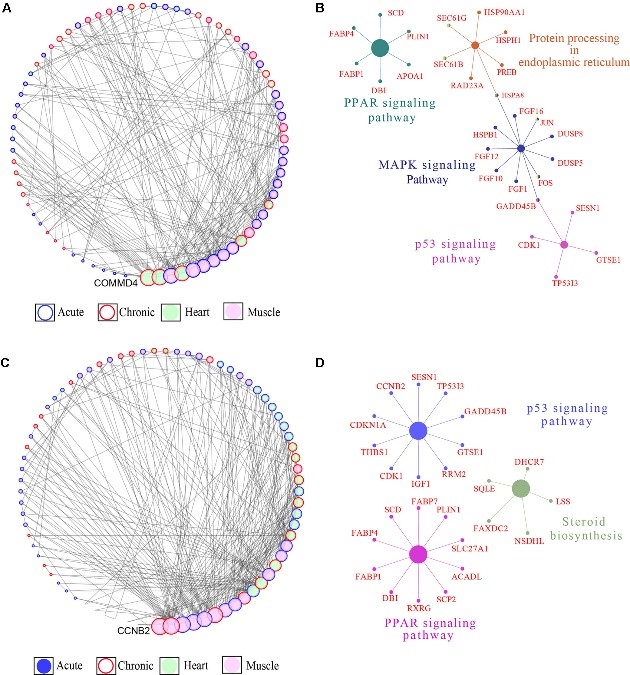
Figure 3.2.4 Gene coexpression network (GCN) and pathway enrichment analysis integrated for the skeletal and cardiac muscle DEGs. (A) Degree sorted network of DEGs in at least one contrast in the highland chickens. The nodes are genes, and the edges are based on correlation coefficients. Only genes with a partial correlation | r | of ≥0.99 were included in network. Node color denotes the tissue type in which the gene expression was the highest, while node border denotes the stage at which the gene expression was the highest. (B) KEGG pathway networks in which all the genes in the highland GCN network were enriched. (C) Degree sorted network of DEG in at least one contrast in the lowland chickens. The nodes are genes, and the edges are based on correlation coefficients. Only genes with a partial correlation | r | of ≥0.99 were included in network. Node color denotes the tissue type in which the gene expression was the highest, while node border denotes the stage at which the gene expression was the highest. (D) KEGG pathway networks in which all the genes in the lowland GCN network were enriched.
4. References
[1] Zhu, K. P., Zhang, C. L., Ma, X. L., Hu, J. P., Cai, T., & Zhang, L. (2019). Analyzing the interactions of mRNAs and ncRNAs to predict competing endogenous RNA networks in osteosarcoma chemo-resistance. Molecular Therapy, 27(3), 518-530. doi: 10.1016/j.ymthe.2019.01.001
[2] Srikanth K, Kumar H, Park W, et al. Cardiac and Skeletal Muscle Transcriptome Response to Heat Stress in Kenyan Chicken Ecotypes Adapted to Low and High Altitudes Reveal Differences in Thermal Tolerance and Stress Response. Front Genet. 2020;11:197. doi:10.3389/fgene.2019.00993


