

How to Request a Quote

Form
Please download and fill in the

Email
And then send the form to [email protected]

Feedback
We will contact you by email as soon as possible, please make sure your Email address is correct and check your email in time.
1. Overview
Amplicon sequencing uses the second and third generation sequencing platforms to perform high-throughput sequencing of specific products such as 16S rDNA, 18S rDNA and ITS, then analyzes the variation in the sequences, and obtain the microbial community structure, evolutionary relationship in environmental samples and so on. This technology breaks through the shortcomings that most traditional microorganisms cannot be cultivated, 16S/18S/ITS Sequencing can directly sequence genetic material that is directly recovered from environmental samples. The services provided by APExBIO can benefit research such as the exploration of biodiversity.
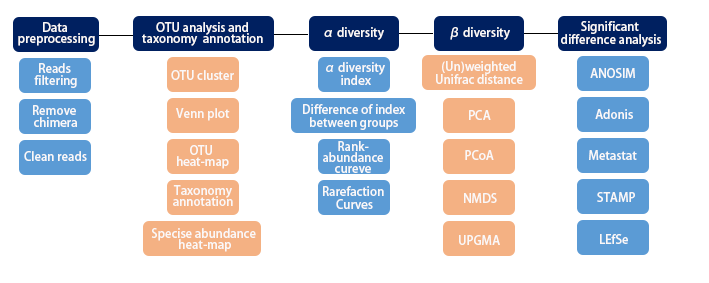
2. Workflow
3. Applications
3.1 Specific gut microbiome signature predicts the early-stage lung cancer
Abstract
Alterations of gut microbiota have been implicated in multiple diseases including cancer. However, the gut microbiota spectrum in lung cancer remains largely unknown. Here we profiled the gut microbiota composition in a discovery cohort containing 42 early-stage lung cancer patients and 65 healthy individuals through the 16S ribosomal RNA (rRNA) gene sequencing analysis. We found that lung cancer patients displayed a significant shift of microbiota composition in contrast to the healthy populations. To identify the optimal microbiota signature for noninvasive diagnosis purpose, we took advantage of Support-Vector Machine (SVM) and found that the predictive model with 13 operational taxonomic unit (OTU)-based biomarkers achieved a high accuracy in lung cancer prediction (area under curve, AUC = 97.6%). This signature performed reasonably well in the validation cohort (AUC = 76.4%), which contained 34 lung cancer patients and 40 healthy individuals. To facilitate potential clinical practice, we further constructed a ‘patient discrimination index’ (PDI), which largely retained the prediction efficiency in both the discovery cohort (AUC = 92.4%) and the validation cohort (AUC = 67.7%). Together, our study uncovered the microbiota spectrum of lung cancer patients and established the specific gut microbial signature for the potential prediction of the early-stage lung cancer.
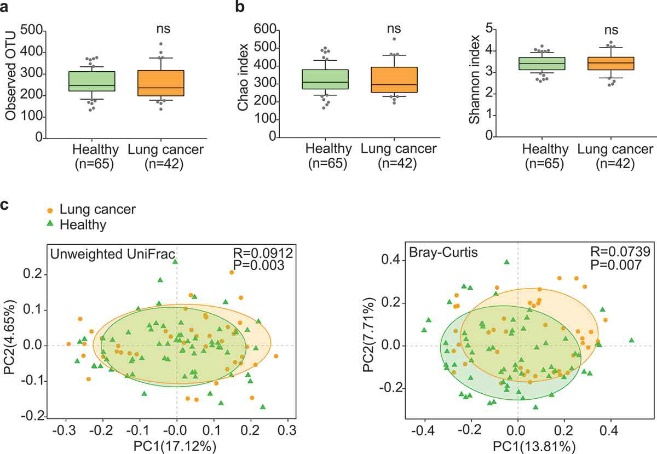
Figure 3.1.1 Gut microbiota dysbiosis in lung cancer patients. (a) Numbers of OTUs observed in patients and healthy controls. (b) Microbial richness based on the Chao index and diversity based on the Shannon index. The box represented the interquartile range (IQR) between the first and the third quartiles, and the midline represented the median. Whiskers extended to values within 1.5 times IQR. Circles indicated outliers beyond the whiskers. (c) Principal coordinates analysis (PCoA) for lung cancer (orange) and healthy control samples (green). Left, Unweighted UniFrac; right, Bray–Curtis. Significant differences were observed between patients and healthy controls with ANOSIM test (UniFrac, R = 0.0912, P = .003; Bray–Curtis, R = 0.0739, P = .007). The first two principal coordinates (PCs) were each labeled with the percentage of variance explained.
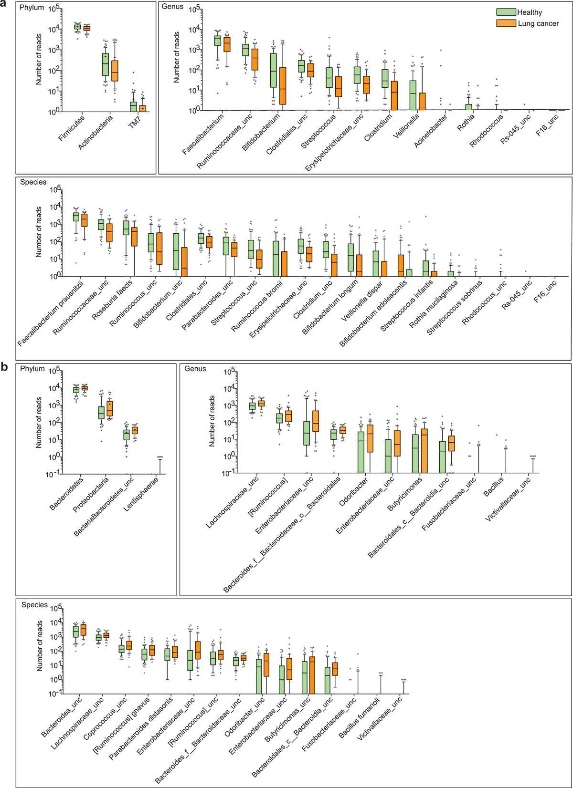
Figure 3.1.2 Differential abundance of gut microbiota in lung cancer and healthy controls. The taxa decreased (a) and increased (b) in patients with lung cancer at the phylum, genus, and species levels, p < .05. Green and orange represented the healthy controls (n = 65) and lung cancer patients (n = 42), respectively. The distributions of taxa were based on the number of reads post-filtering and rarefying. The abundance in each group was plotted as log10 scale on the y axis. P values were calculated using the two-tailed Wilcoxon rank-sum test. Description of boxplots was the same as in Figure 3.2.1. Taxa were named as their lowest possible level of classification, with unclassified (unc) indicating no further classification available.
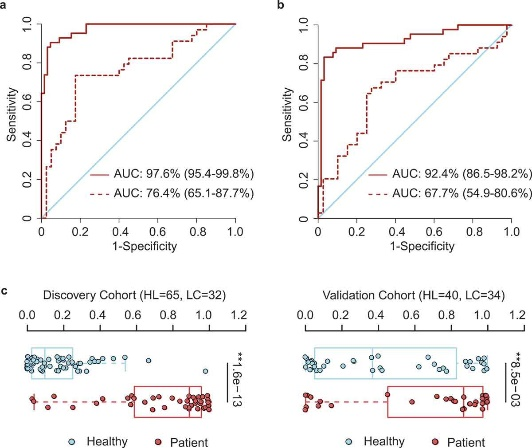
Figure 3.1.3 OTU-based diagnostic biomarkers for lung cancer. (a, b) Receiver operating characteristic (ROC) curves of prediction efficacy for the OTU-based predictors using SVM (a) and PDI (b), respectively. Solid and dashed lines indicated the discovery (patient = 42, healthy = 65) and validation (patient = 34, healthy = 40) cohorts, respectively. (c) PDI distributions in early-stage patients and healthy controls. Two-tailed Wilcoxon rank-sum test, **p < .01.
3.2 Spatiotemporal dynamics of the archaeal community in coastal sediments: assembly process and co-occurrence relationship
Abstract
Studies of marine benthic archaeal communities are updating our view of their taxonomic composition and metabolic versatility. However, large knowledge gaps remain with regard to community assembly processes and inter taxa associations. Here, using 16S rRNA gene amplicon sequencing and qPCR, we investigated the spatiotemporal dynamics, assembly processes, and co-occurrence relationships of the archaeal community in 58 surface sediment samples collected in both summer and winter from across ~1500 km of the eastern Chinese marginal seas. Clear patterns in spatiotemporal dynamics in the archaeal community structure were observed, with a more pronounced spatial rather than seasonal variation. Accompanying the geographic variation was a significant distance-decay pattern with varying contributions from different archaeal clades, determined by their relative abundance. In both seasons, dispersal limitation was the most important process, explaining ~40% of the community variation, followed by homogeneous selection and ecological drift, that made an approximately equal contribution (~30%). This meant that stochasticity rather than determinism had a greater impact on the archaeal community assembly. Furthermore, we observed seasonality in archaeal co-occurrence patterns: closer inter-taxa connections in winter than in summer, and unmatched geographic patterns between community composition and co-occurrence relationship. These results demonstrate that the benthic archaeal community was assembled under a seasonal-consistent mechanism but the co-occurrence relationships changed over the seasons, indicating complex archaeal dynamic patterns in coastal sediments of the eastern Chinese marginal seas.
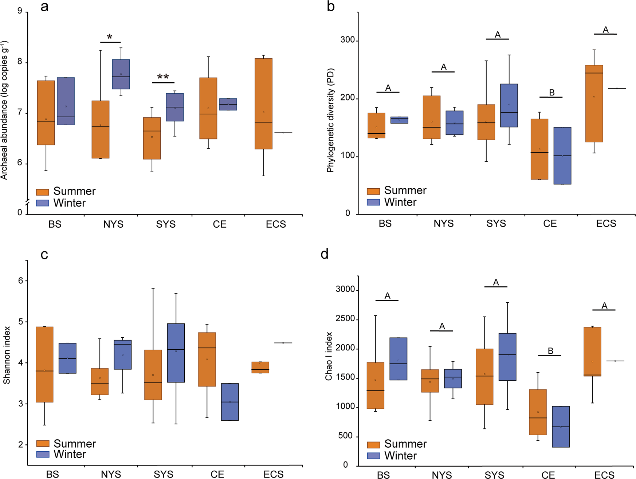
Figure 3.2.1 16S rRNA gene copy numbers derived from qPCR (a) and indices of alpha diversity shown as phylogenetic diversity (b), Shannon (c) and Chao I (d). Significant differences between seasons in each sampling area are marked by stars (**P < 0.01; *P < 0.05). Significant differences between sampling areas are marked by different capital letters. BS, Bohai Sea; NYS, north Yellow Sea; SYS, south Yellow Sea; ECS, East China Sea; CE, Changjiang Estuary.
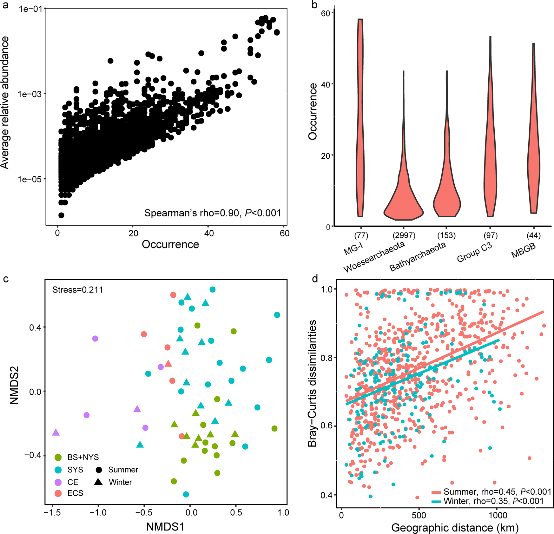
Figure 3.2.2 a. Abundance–occupancy relationship based on all OTUs. Spearman’s rank correlation was calculated between average relative abundance and numbers of site occurred; b. Occurrence patterns of OTUs belonging to the top five most abundant archaeal clades. Numbers in parenthesis indicate the number of OTUs for each clade; c. Ordination of community using the non-metric multidimensional scaling based on Bray–Curtis dissimilarities; d. Pairwise relationships between Bray–Curtis dissimilarities and geographic distances for both winter and summer samples. Spearman’s rank correlations were calculated.
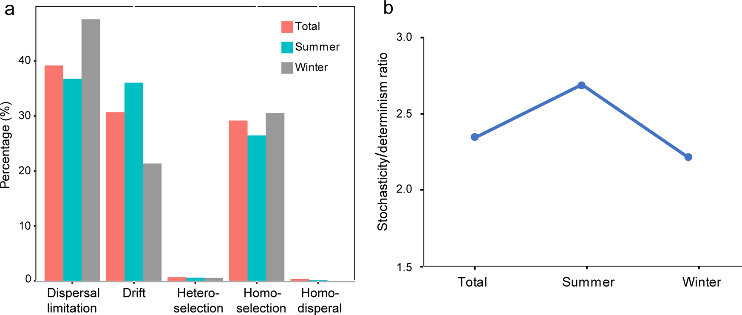
Figure 3.2.3 a. Relative contribution of different ecological processes; b. The ratio of stochasticity and determinism.
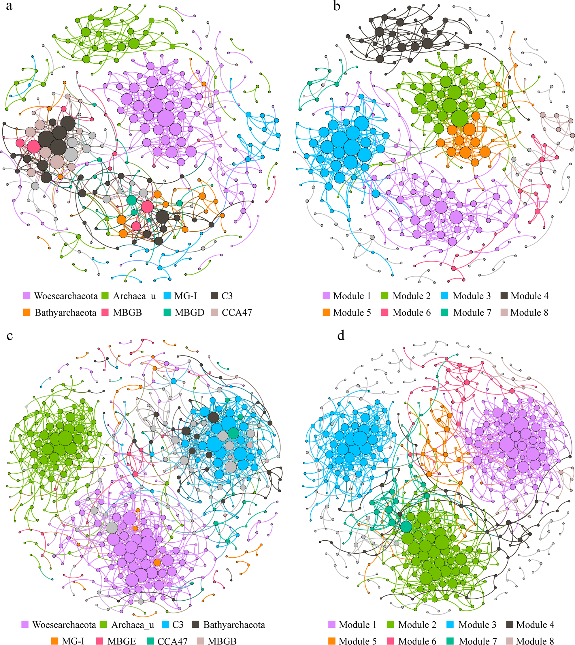
Figure 3.2.4 Each shown connection has a correlation coefficient >|0.7| and a P value < 0.01. The size of each node is proportional to the number of connections. The upper panel shows the network of summer samples with OTUs colored by taxonomy (a) and modularity (b); the lower panel shows the network of winter samples with OTUs colored by taxonomy (c) and modularity (d).
4. References
[1] Yajuan Zheng, Zhaoyuan Fang, Yun Xue, Jian Zhang, Junjie Zhu, Renyuan Gao, Shun Yao, Yi Ye, Shihui Wang, Changdong Lin, Shiyang Chen, Hsinyi Huang, Liang Hu, Ge-Ning Jiang, Huanlong Qin, Peng Zhang, Jianfeng Chen & Hongbin Ji (2020) Specific gut microbiome signature predicts the early-stage lung cancer, Gut Microbes, 11:4, 1030-1042, DOI: 10.1080/19490976.2020.1737487
[2] Liu J, Zhu S, Liu X, Yao P, Ge T, Zhang XH. Spatiotemporal dynamics of the archaeal community in coastal sediments: assembly process and co-occurrence relationship. ISME J. 2020 Jun;14(6):1463-1478. doi: 10.1038/s41396-020-0621-7. Epub 2020 Mar 4. PMID: 32132664; PMCID: PMC7242467.