How to Request a Quote

Form
Please download and fill in the
Services Registration Form.

Email
And then send the form to [email protected]

Feedback
We will contact you by email as soon as possible, please make sure your Email address is correct and check your email in time.
1. Overview
Assay for Transposase-Accessible Chromatin sequencing (ATAC-seq) employs Tn5, a transposase which can easily bind to the open chromatin, and sequencing the DNA captured by the enzyme. This technique has been used to identify open chromatin with a higher signal-to-noise ratio and lower input requirements than other approaches.
APExBIO offers the entire ATAC-seq workflow, from library preparation to data analysis. Our services can provide information about all open sequences in the genome, we also help you analyze regulatory elements and find transcription factor binding sites.
2. Workflow

3. Applications
3.1 ATAC-seq reveals alterations in open chromatin in pancreatic islets from subjects with type 2 diabetes
Abstract
Impaired insulin secretion from pancreatic islets is a hallmark of type 2 diabetes (T2D). Altered chromatin structure may contribute to the disease. We therefore studied the impact of T2D on open chromatin in human pancreatic islets. We used assay for transposase-accessible chromatin using sequencing (ATAC-seq) to profile open chromatin in islets from T2D and non-diabetic donors. We identified 57,105 and 53,284 ATAC-seq peaks representing open chromatin regions in islets of non-diabetic and diabetic donors, respectively. The majority of ATAC-seq peaks mapped near transcription start sites. Additionally, peaks were enriched in enhancer regions and in regions where islet-specific transcription factors (TFs), e.g. FOXA2, MAFB, NKX2.2, NKX6.1 and PDX1, bind. Islet ATAC-seq peaks overlap with 13 SNPs associated with T2D (e.g. rs7903146, rs2237897, rs757209, rs11708067 and rs878521 near TCF7L2, KCNQ1, HNF1B, ADCY5 and GCK, respectively) and with additional 67 SNPs in LD with known T2D SNPs (e.g. SNPs annotated to GIPR, KCNJ11, GLIS3, IGF2BP2, FTO and PPARG). There was enrichment of open chromatin regions near highly expressed genes in human islets. Moreover, 1,078 open chromatin peaks, annotated to 898 genes, differed in prevalence between diabetic and non-diabetic islet donors. Some of these peaks are annotated to candidate genes for T2D and islet dysfunction (e.g. HHEX, HMGA2, GLIS3, MTNR1B and PARK2) and some overlap with SNPs associated with T2D (e.g. rs3821943 near WFS1 and rs508419 near ANK1). Enhancer regions and motifs specific to key TFs including BACH2, FOXO1, FOXA2, NEUROD1, MAFA and PDX1 were enriched in differential islet ATAC-seq peaks of T2D versus non-diabetic donors. Our study provides new understanding into how T2D alters the chromatin landscape, and thereby accessibility for TFs and gene expression, in human pancreatic islets.
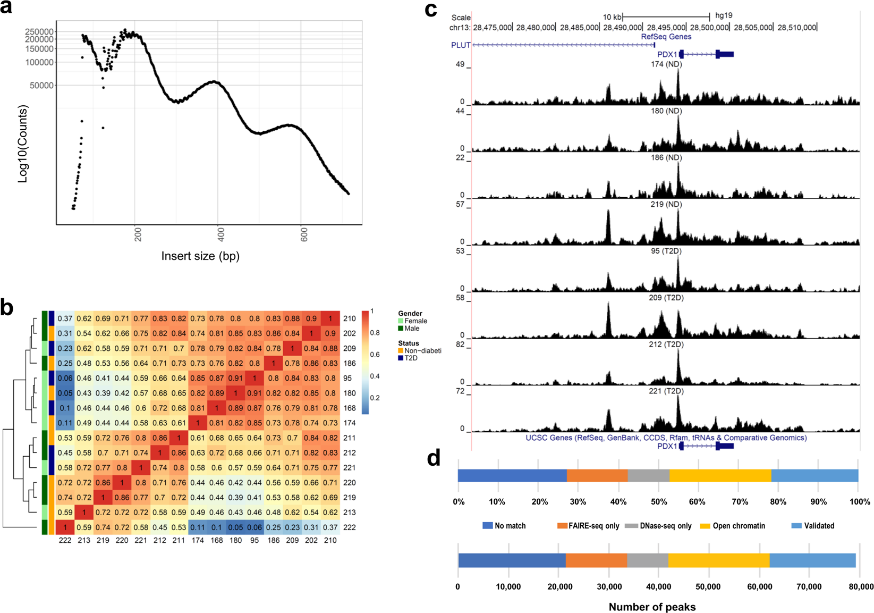
Figure 3.1.1 (a) Insert size distributions of islet ATAC-seq data showing clear nucleosome phasing. The first peak represents the open chromatin, peak 2 to 4 represent mono-, di- and tri-nucleosomal regions. (b) Hierarchical clustering of the Spearman correlation of the ATAC-seq data, as calculated by binning reads for consecutive bins of 10 kilobases including ATAC-seq data of all analyzed islet samples and excluding Y-chromosome data. (c) Representative sequencing tracks for the PDX1 locus show distinct ATAC-seq peaks at the promoter and the known enhancer in human islets. The ATAC-seq data have been normalized to take sequencing depth into account and the scale on the y-axis was chosen for optimal visualization of peaks for each sample. (d) Proportions of islet ATAC-seq peaks identified in at least three donors (79,255 open chromatin peaks) overlapping with ENCODE open chromatin data generated using FAIRE-seq and DNaseI-seq in human islets. ATAC-seq peaks overlap with the following number and categories of ENCODE peaks: 17,172 validated peaks, 20,178 open chromatin peaks, 8,288 DNaseOnly peaks and 12,063 FAIREonly peaks. 21,554 ATAC-seq peaks did not match with ENCODE peaks.

Figure 3.1.2 (a) Histogram showing the distance from the nearest transcription start site (TSS) for all islet ATAC-seq peaks. (b-c) Proportions of islet ATAC-seq peaks annotated to different genomic regions in (b) non-diabetic donors and (c) donors with type 2 diabetes. Here, TSS-50 kb represents 1,501–50,000 bp upstream of the TSS, TSS-1500 represents 201–1,500 bp upstream of the TSS, TSS-200 represents 1–200 bp upstream of the TSS, and TTS represents 1–10,000 bp downstream of the transcript termination site.
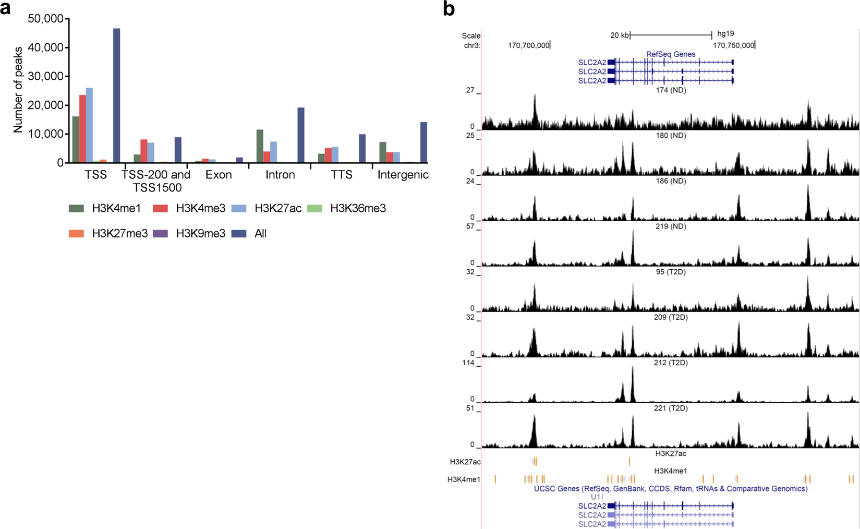
Figure 3.1.3 (a) Bar graph of overlapping islet ATAC-seq peaks in non-diabetic donors and different histone modifications. Based on chi-square tests and false discovery rate (FDR) analysis (q < 0.001, P < 9 × 10−153) more islet ATAC-seq peaks than expected overlapped with H3K4me1, H3K4me3, and H3K27ac and less peaks than expected overlapped with H3K27me3, H3K9me3 and H3K36me3. (b) Representative sequencing tracks for the SLC2A2 locus show ATAC-seq peaks that overlap with H3K4me1 and H3K27ac in human islets. The ATAC-seq data have been normalized to take sequencing depth into account and the scale on the y-axis was chosen for optimal visualization of peaks for each sample.
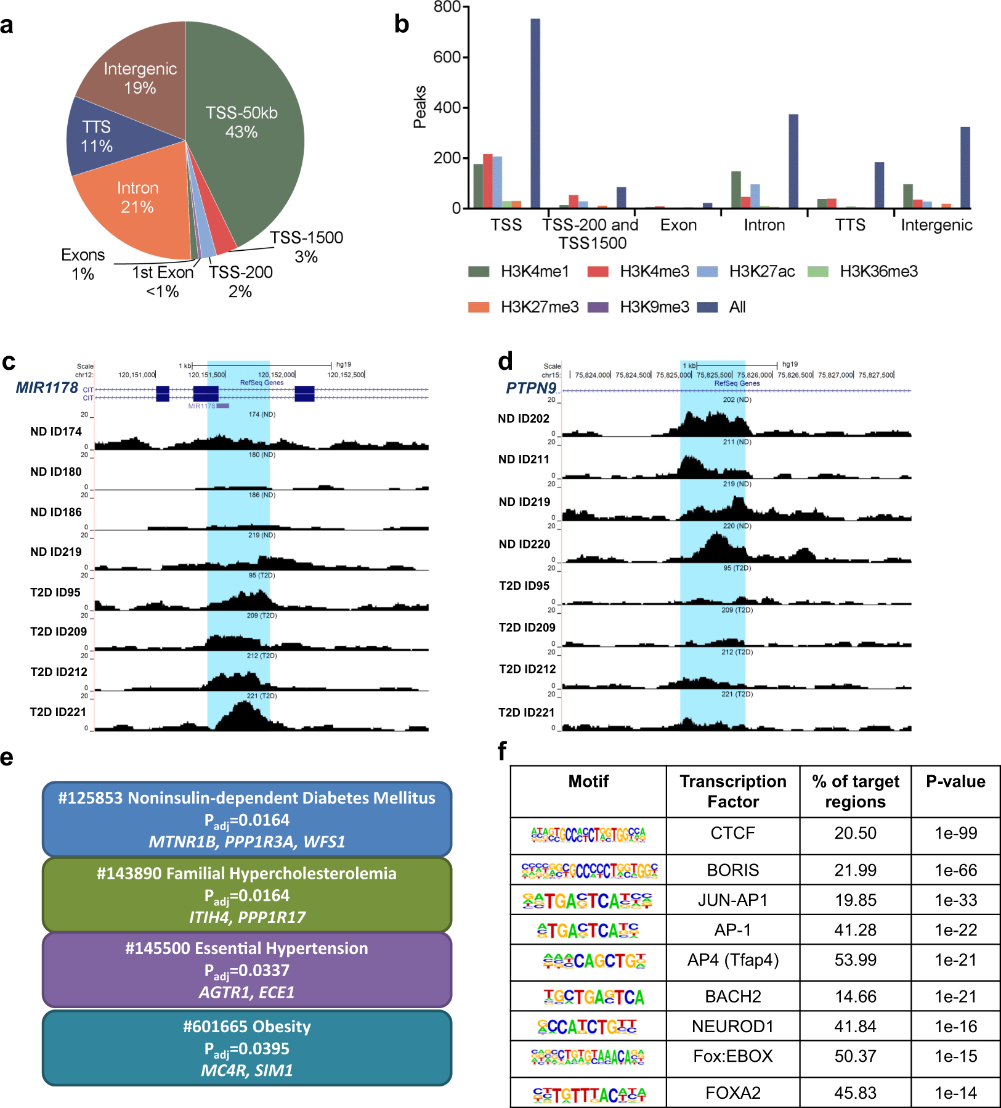
Figure 3.1.4 (a) Proportions of differential islet ATAC-seq peaks of type 2 diabetic versus non-diabetic donors annotated to different genomic regions. (b) Bar graph of differential islet ATAC-seq peaks of type 2 diabetic versus non-diabetic donors that overlap with histone modifications. (c-d) Sequencing tracks of ATAC-seq peaks that are more prevalent in donors with type 2 diabetes (annotated to MIR1178) (c) or non-diabetics (annotated to PTPN9) (d). The ATAC-seq data have been normalized to take sequencing depth into account. (e) Disease related pathways based on enrichment of genes annotated to differential islet ATAC-seq peaks of type 2 diabetic versus non-diabetic donors. The same pathways were significant when analyzing genes annotated to the 1,044 peaks enriched in T2D versus non-diabetic donors (Padj = 0.0159, Padj = 0.0175, Padj = 0.324 and Padj = 0.0425, respectively). Padj are adjusted by FDR. (f) Enrichment of transcription factor recognition sequences in differential islet ATAC-seq peaks of type 2 diabetic versus non-diabetic donors based on HOMER17.
3.2 Changes in chromatin accessibility between Arabidopsis stem cells and mesophyll cells illuminate cell type‐specific transcription factor networks
Abstract
Cell differentiation is driven by changes in the activity of transcription factors (TFs) and subsequent alterations in transcription. To study this process, differences in TF binding between cell types can be deduced by probing chromatin accessibility. We used cell type‐specific nuclear purification followed by the assay for transposase‐accessible chromatin (ATAC‐seq) to delineate differences in chromatin accessibility and TF regulatory networks between stem cells of the shoot apical meristem (SAM) and differentiated leaf mesophyll cells in Arabidopsis thaliana. Chromatin accessibility profiles of SAM stem cells and leaf mesophyll cells were very similar at a qualitative level, yet thousands of regions having quantitatively different chromatin accessibility were also identified. Analysis of the genomic regions preferentially accessible in each cell type identified hundreds of overrepresented TF‐binding motifs, highlighting sets of TFs that are probably important for each cell type. Within these sets, we found evidence for extensive co‐regulation of target genes by multiple TFs that are preferentially expressed in each cell type. Interestingly, the TFs within each of these cell type‐enriched sets also showed evidence of extensively co‐regulating each other. We further found that preferentially accessible chromatin regions in mesophyll cells tended to also be substantially accessible in the stem cells, whereas the converse was not true. This observation suggests that the generally higher accessibility of regulatory elements in stem cells might contribute to their developmental plasticity. This work demonstrates the utility of cell type‐specific chromatin accessibility profiling for the rapid development of testable models of regulatory control differences between cell types.
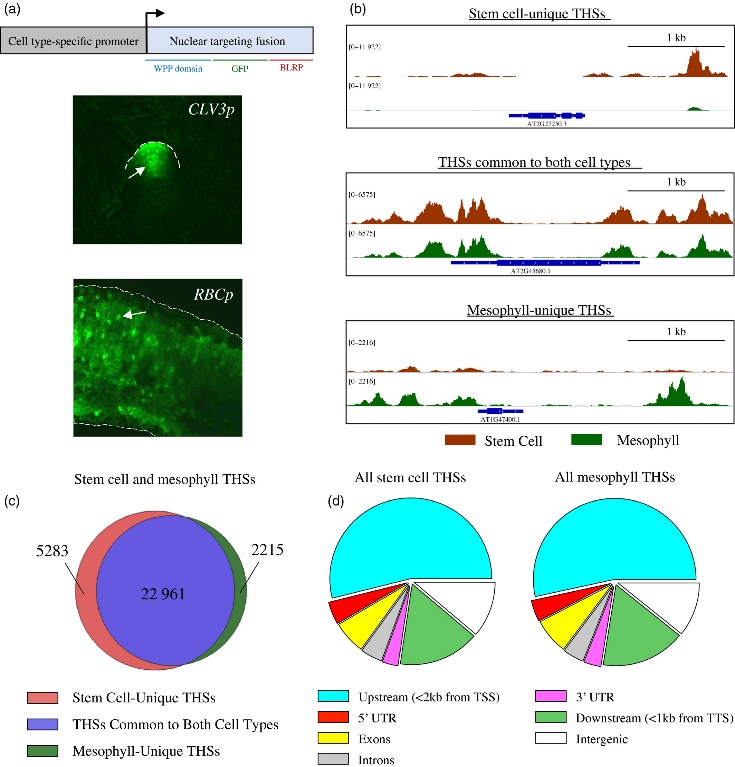
Figure 3.2.1 Characterization of INTACT (isolation of nuclei tagged in specific cell types) transgenic lines and overview of assay for transposase‐accessible chromatin (ATAC‐seq) data from each cell type. (a) The upper panel is a schematic representation of the INTACT system for isolating nuclei from specific cell types. The nuclear targeting fusion (NTF) contains a WPP nuclear envelope‐binding domain, green fluorescent protein (GFP) for visualization, and a biotin ligase recognition peptide (BLRP), which can be biotinylated by the BirA biotin ligase. BirA is expressed constitutively while the NTF is driven from a cell type‐specific promoter. When these transgenes are co‐expressed in a cell the nucleus becomes biotinylated, allowing all nuclei of that cell type to be selectively purified with streptavidin beads. Below the gene diagram are confocal images of GFP expression in the CLV3p:NTF;ACT2p:BirA line (upper) and RBCp:NTF;ACT2p:BirA line (lower), showing NTF expression in the shoot apical meristem and mesophyll cells, respectively. Fluorescent nuclei are labeled with arrowheads. (b) Three Integrated Genome Viewer (IGV) snapshots of normalized ATAC‐seq reads from shoot apical stem cell (red) and mesophyll (green) nuclei. Different categories of transposase hypersensitive sites (THSs) are observed. Top panel: stem cell‐unique – THSs identified only in stem cells. Middle panel: common to both cell types – THSs that were identified in both stem cells and mesophyll cells. Bottom panel: mesophyll‐unique – THSs that were identified only in mesophyll cells. (c) Overlap of stem cell and mesophyll ATAC‐seq THSs identified by peak calling in at least two biological replicates of that cell type. (d) Genomic distribution, generated using the software tool PAVIS, of all the THSs identified in two replicates for either stem cell or mesophyll ATAC‐seq.
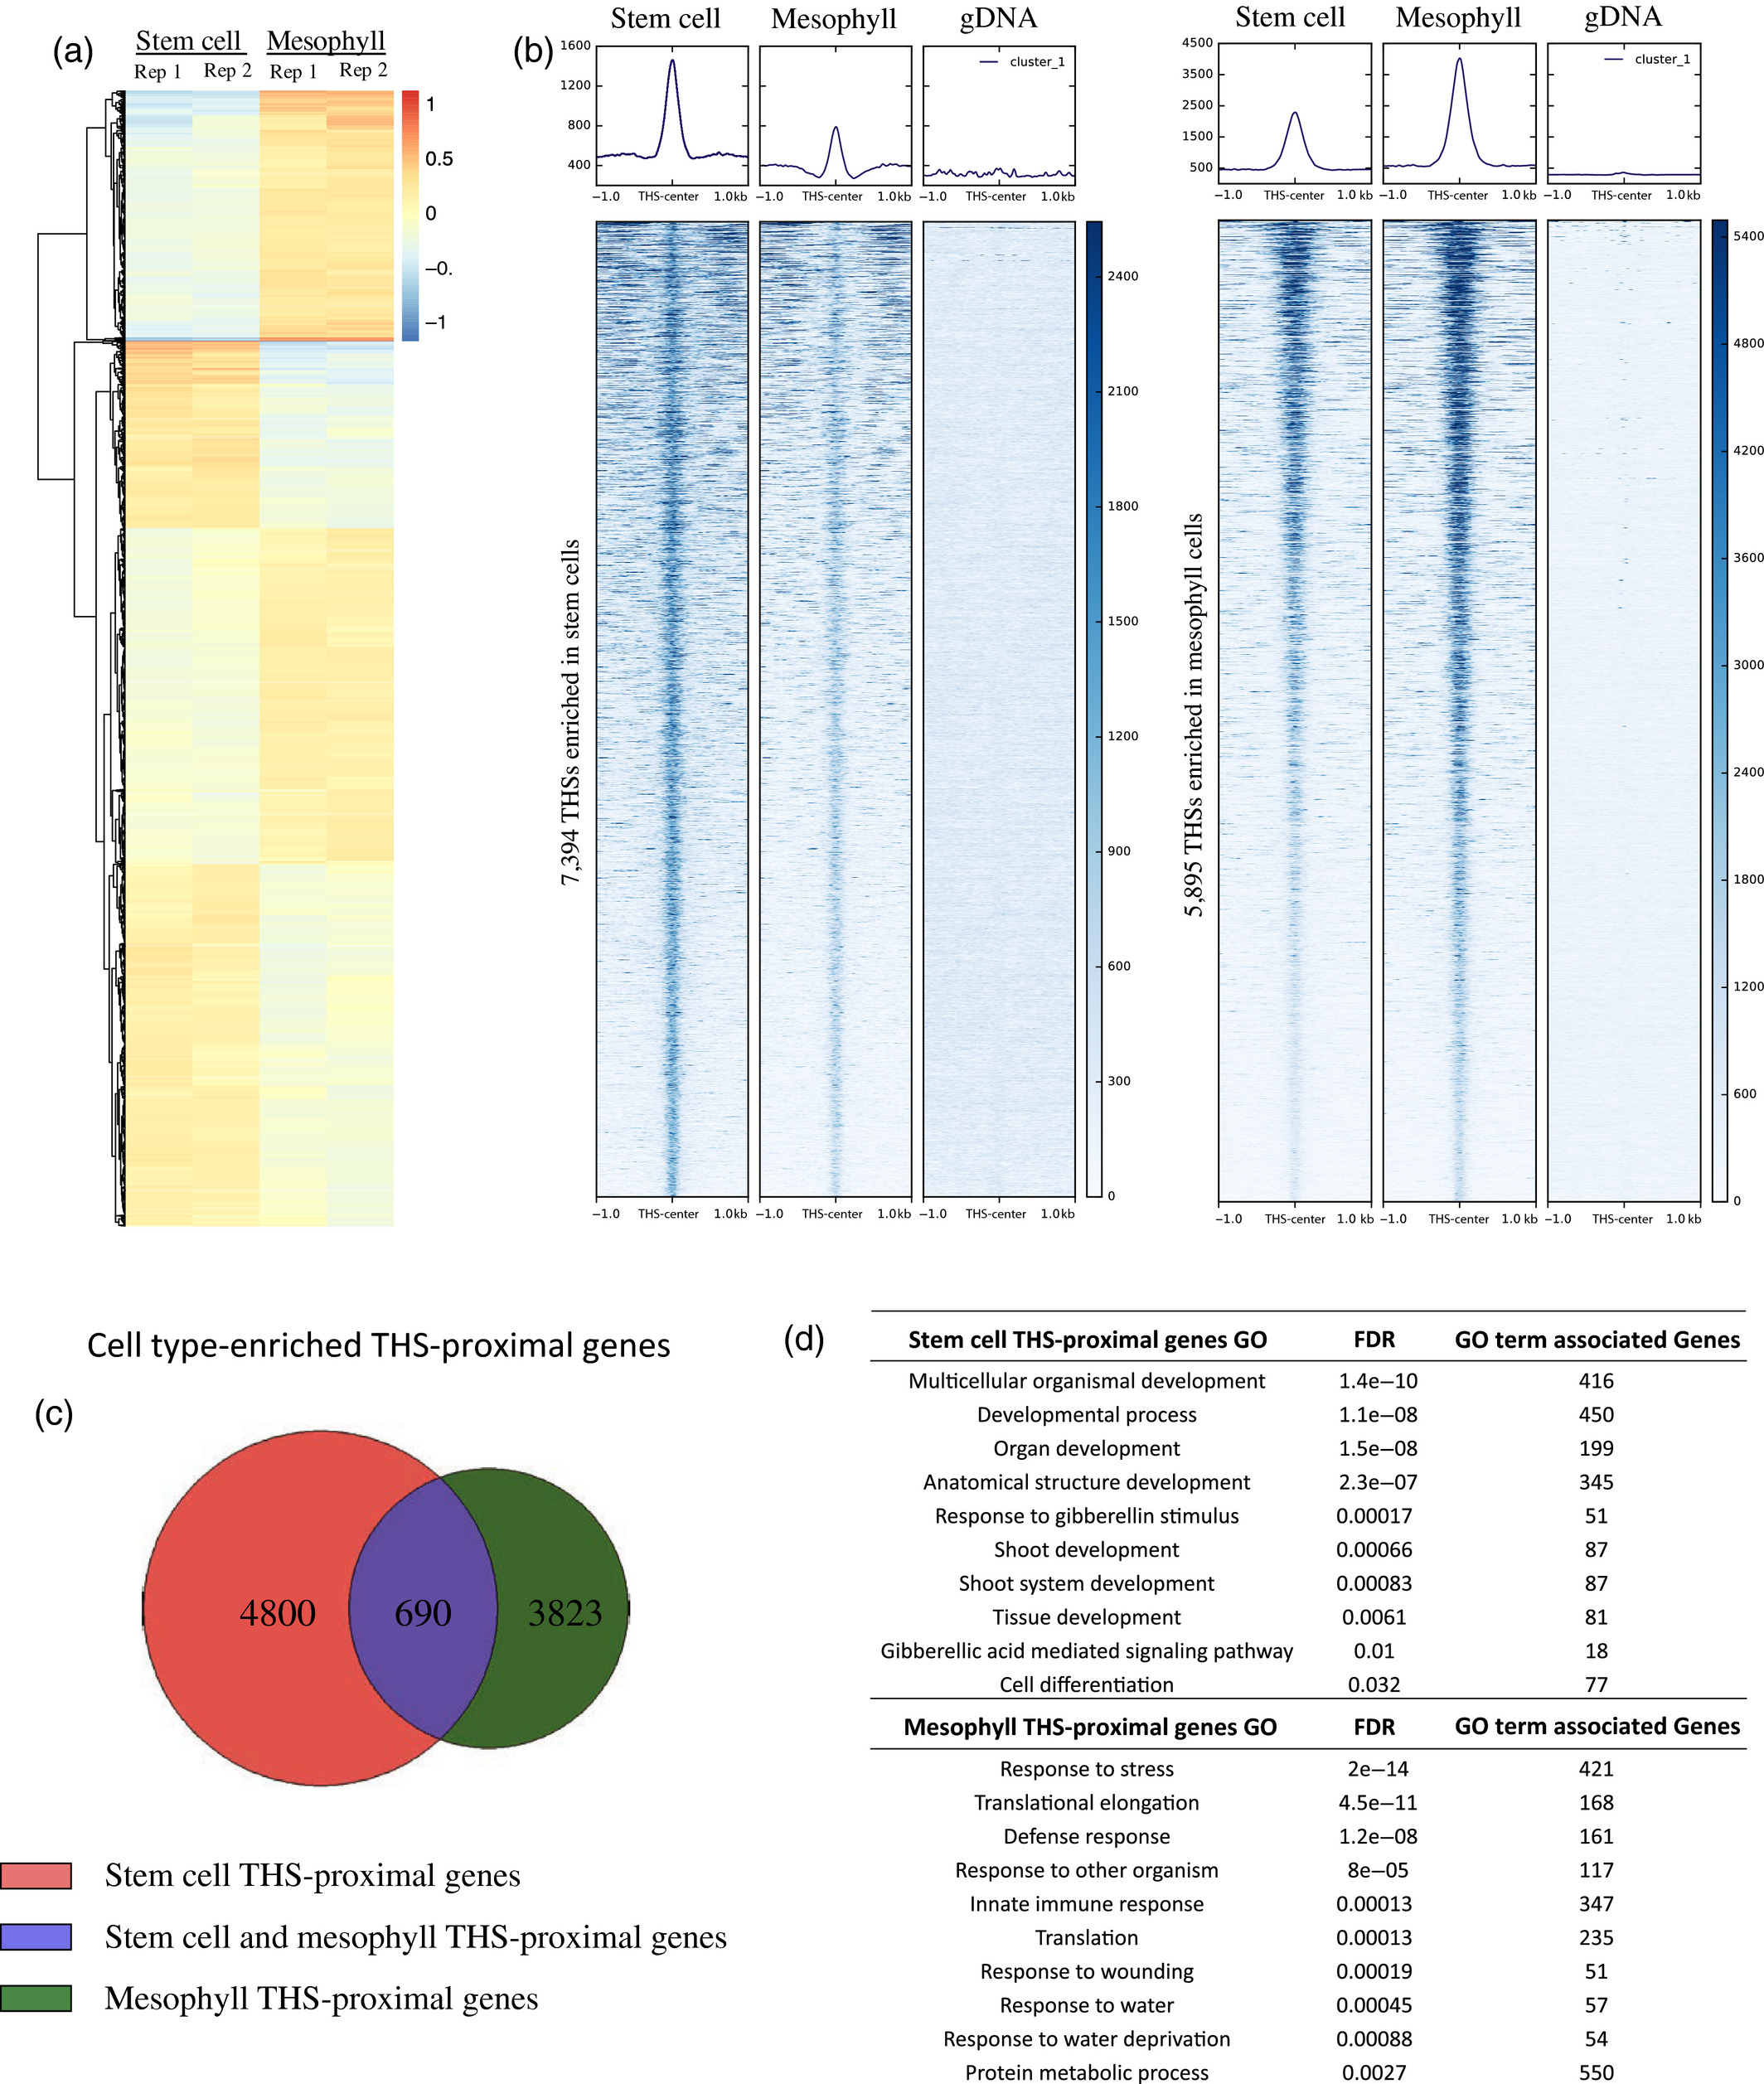
Figure 3.2.2 Chromatin accessibility differences between stem cells and mesophyll cells.
(a) Heatmap showing the log ratio of normalized read count of the top 13 289 transposase hypersensitive sites (THSs) that are statistically different between stem cell and mesophyll assay for transposase‐accessible chromatin (ATAC‐seq) samples. Each line on the heatmap represents a single THS, and the values at that region are given for each of two replicates in each cell type. Increased chromatin accessibility between the four samples is colored red and decreased chromatin accessibility is colored blue, compared with an average value set to 0.
(b) Normalized read signal in stem cell, mesophyll, and genomic DNA ATAC‐seq samples over cell type‐enriched THS regions. The left set of panels show ATAC‐seq signal over the 7394 stem cell‐enriched THSs, while the right set of panels show ATAC‐seq signal over the 5895 THSs enriched in mesophyll cells.
(c) Each cell type‐enriched THS was assigned to its nearest transcription start site as the putatively regulated target gene. The Venn diagram shows the overlap of cell type‐enriched THS‐proximal genes.
(d) Examples of 10 Gene Ontology (GO) terms that were found only among the lists of genes that have a nearby cell type‐enriched THS in a given cell type (i.e. from the non‐overlapping portions of the diagram in part (c)). FDR, false discovery rate.
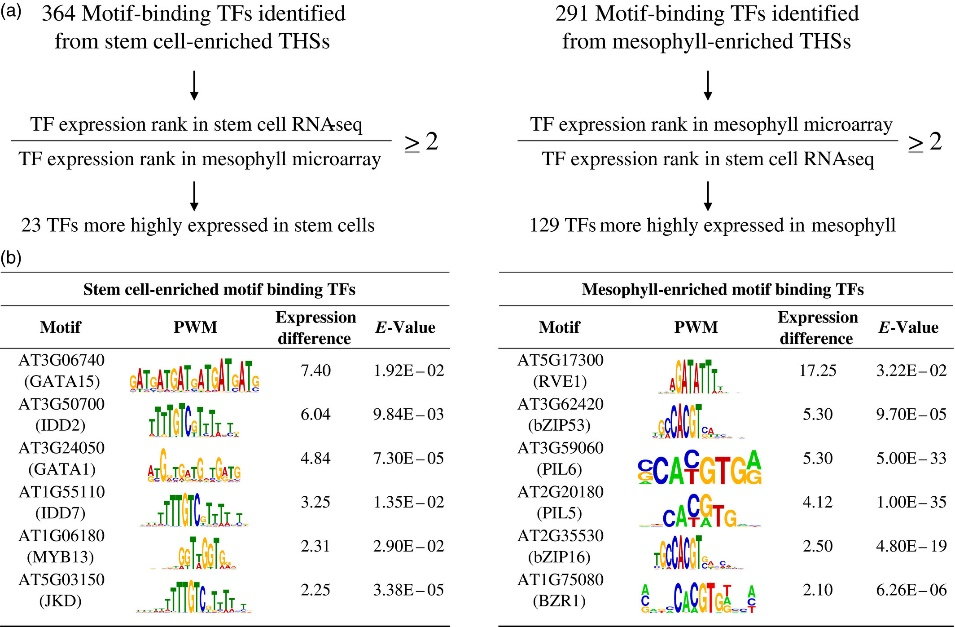
Figure 3.2.3 Sequence motifs identified in cell type‐enriched transposase hypersensitive sites (THSs).
(a) Cell type‐enriched THS sequences were centered and scaled to 300 bp, repeat masked and analyzed with MEME‐ChIP. Motifs that had an E‐value equal to or less than 0.05 were considered significant. The 364 and 291 transcription factors (TFs) associated with overrepresented motifs from stem cell‐ and mesophyll‐enriched THSs, respectively, were further separated by their ranked expression difference between previously reported stem cell RNA‐seq and mesophyll microarray data. Only those TFs that had at least a two‐fold higher expression rank difference for the cell type in which their motif was identified were kept (Table S5).
(b) Six TFs that potentially regulate transcriptional networks for each cell type, their position weight matrix (PWM), expression rank difference between the two cell types and E‐value from the MEME‐ChIP analysis are shown for stem cells (left) and mesophyll (right). The TFs are ranked by their difference in expression rank between the two cell types, with the highest expression rank difference for the corresponding cell type at the top.
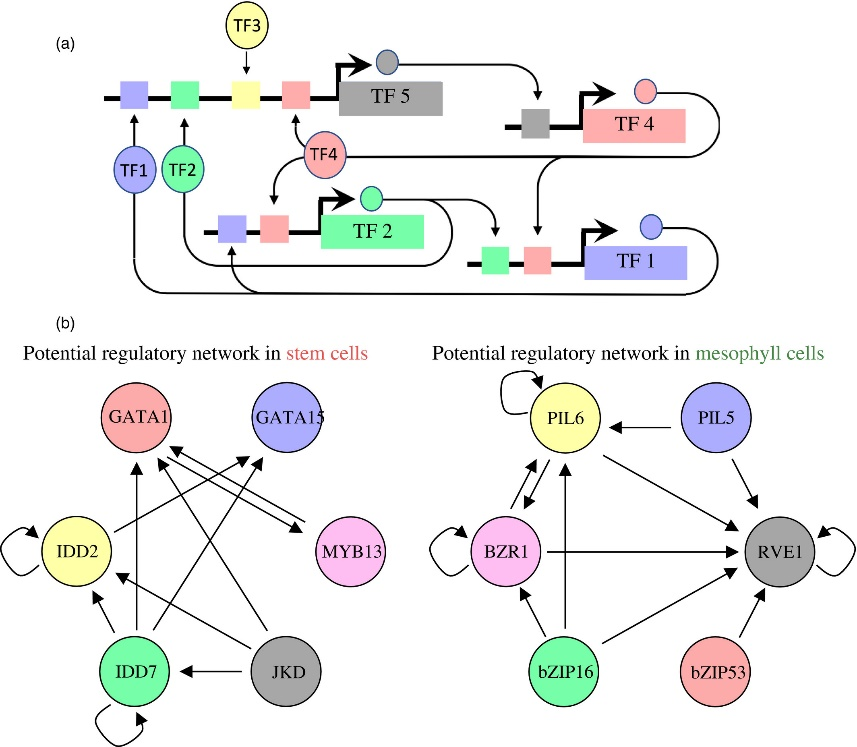
Figure 3.2.4 Proposed regulatory pathways for key transcription factors (TFs) in stem cells and mesophyll cells.
(a) Schematic for identifying regulatory interactions between transcription factors (TFs). A predicted binding site for a TF, such as TF5, may regulate the expression of another TF, such as TF4. Subsequently regulated TFs may regulate other TFs, making up a TF network that is active within a cell type.
(b) The putative regulatory networks for stem cells (left) and mesophyll (right) are shown. Each TF circle has regulatory inputs (stem cell‐ or mesophyll‐predicted TF‐binding site within its proximal regulatory regions) and regulatory outputs (that TF's predicted binding site in the other TF gene's proximal regulatory regions). For example, IDD7 has four regulatory outputs to IDD2, GATA1, GATA15 and itself, and one regulatory input to itself.
4. References